
A Look Back, A Look Ahead
Looking back at the climate numbers for January in Birmingham and looking ahead to what we usually can expect in February:
The mean temperature for January 2016 at Birmingham was 42.5F, which is slightly cooler than the 43.8F average mean. The average high for the month was 52F and the average low was 33.1F. These values are 1.9 and 1.2 degrees below their respective long-term averages.
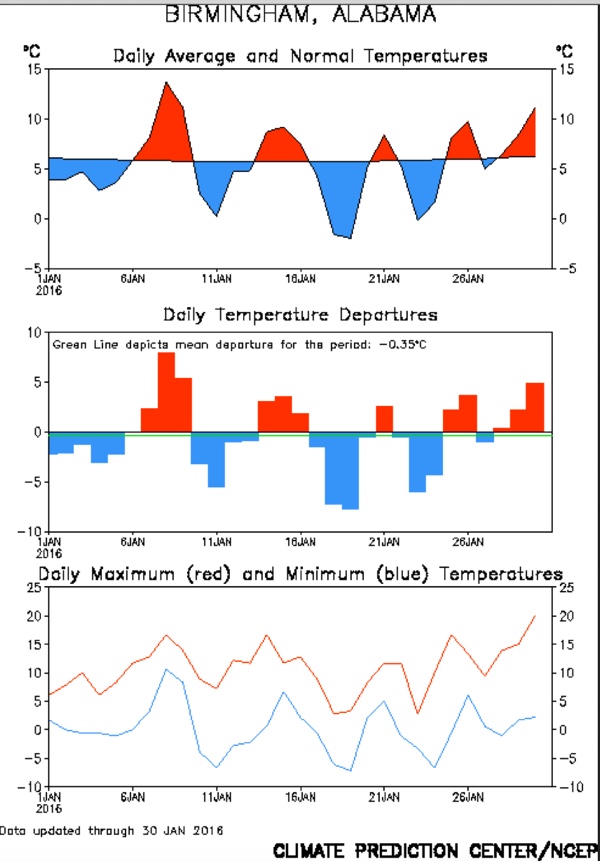
The mercury dropped to freezing or colder 17 times in January 2016, slightly more than the 14.9 times that we average. The coldest reading was 19F on the 19th. The warmest was the 72F we saw yesterday.
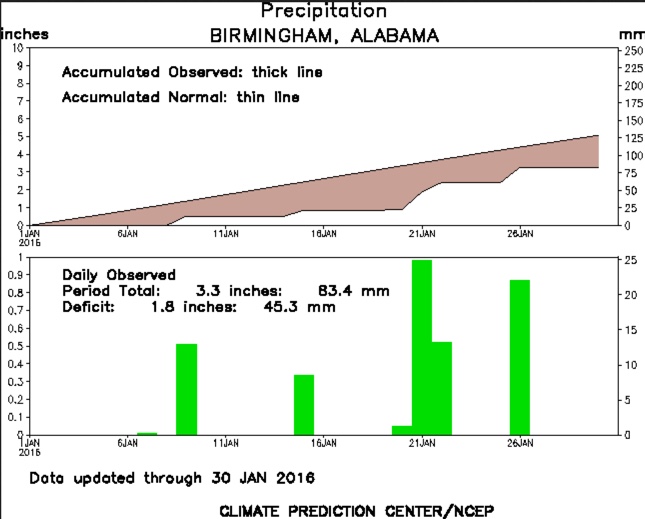
A total of 3.28 inches of precipitation fell in the month, well short of the average 4.84 inches we would expect. Rain fell on 6 days, something that usually occurs on 10.5 days on average.
A trace of snow was reported. On average, we receive 0.6 inches of the white stuff. In January, we experienced thunder on one day, something that occurs on average 1.9 times in the month.
A rough approximation shows that we received about 55% of normal sunshine this month, up from the 41% we usually see in our gloomiest month. So if you were a little chilly last month, at least you had a little extra sunshine to show for it!
LOOKING AHEAD
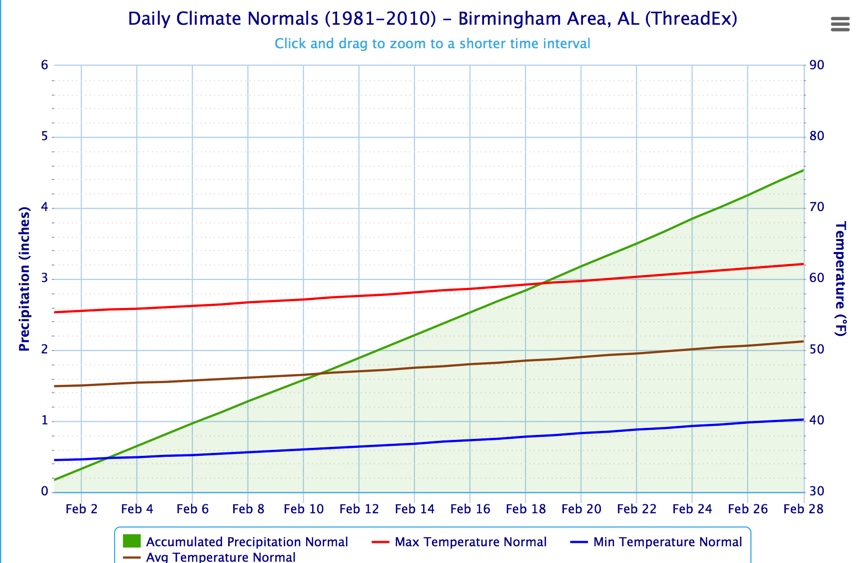
February 2nd is Candlemas Day. It is the traditional midpoint of winter. You know it as Groundhog Day. By early February, Alabama is beginning to really feel the move toward spring. Days are lengthening and average temperatures are slowing warming as the amount of sunshine increases each day. At the beginning of the month, the average high and low for Birmingham is 55F/35F. By the end of the month, the averages are 62F and 40F. On average, the mercury drops to freezing or below on 9.7 nights, down slightly from the 114.9 in January.
Birmingham’s coldest day on record (-10F) occurred on February 13, 1899, during the mother of all U.S. cold waves. Records in Birmingham were kept at the U.S. Weather Bureau Office in Fountain Heights then. If the observation had been made at the current Airport location, the all time low would probably be -14F. The warmest February reading on record in Birmingham is 83F, recorded on three different dates in history.
February is the middle month in the wettest three month period on average in the Magic City. During our “rainy season,” we typically receive just under 15 inches of rain. On average, 4.53 inches of rain falls in Birmingham in February. 17.67 inches fell in February 1961, the wettest second month observed here. February 1968 saw only 1.20 inches of rain, the driest February ever. The 6.00 inches of rain that fell on February 7, 1903 is the daily record for the month.
Typically, it will rain on 10 days in February and thunderstorms occur on 2.3 days. By these measurements, February looks a lot like January. On average, Birmingham receives a 0.1 inches of snow in February. The greatest daily amount of snow observed in the city is 5 inches on February 23, 1901.
After January, which features the lowest percentage of possible sunshine at 41%, February is sunnier featuring 50% of possible sunshine on average, moving toward the sunniest month, May which features 66% of possible sunshine on average. Fog reduces visibility to ¼ mile or less on one day during the month.
Category: Alabama's Weather
About the Author (Author Profile)
Bill Murray is the President of The Weather Factory. He is the site's official weather historian and a weekend forecaster. He also anchors the site's severe weather coverage. Bill Murray is the proud holder of National Weather Association Digital Seal #0001 @wxhistorianSubscribe
If you enjoyed this article, subscribe to receive more just like it.