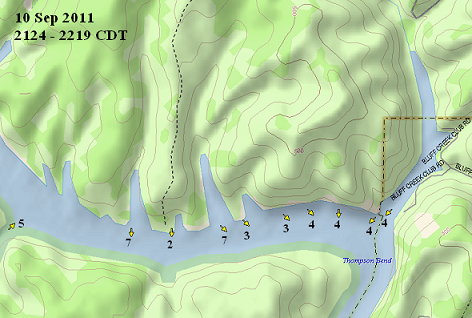
Wind speed and direction. Notice the wind always blows out of the sloughs (from the north on most, from the SW on the one across the river on the left side of the picture), and is stronger near the mouth of sloughs and creeks.

I started noticing 4 years ago that, on clear, calm nights, the wind always seems to blow out of Bluff Creek, a large slough on Bankhead Lake/Warrior River where our cabin is. On our trip back from Tuscaloosa by boat (when we briefly ran out of oil and had to navigate 20 miles of river at night without a spotlight or GPS, just a map and a compass), Jason Simpson and I noted that this breeze was blowing out of other big sloughs and creeks along the river.
We know on a clear, calm night with radiational cooling, the coldest air stays near the ground. If that ground is sloped as it is around a river or creek valley, the cold, dense air near the ground flows downhill, just like water. It seems natural that the air would flow similarly to the water in the same river valley. Detailing this type of flow could be advantageous to the Dept. of Energy, EPA, etc., especially in containing a gas release, etc. along a river. With funding so tight, sometimes we have to go out on our own time and get some pilot data to show them how it looks like it happens, then write a proposal to get some money to do it in great depth, model it, etc.
So, I found a cool instrument called the Airmar PB150, a weather instrument that you can mount on a moving vehicle (it’s made for boats), and it records the wind relative to the boat as you move, then using GPS it figures out what the actual wind is. It also measures temperature and pressure, and logs all this data on any laptop. They had an X-out or something on ebay for about 25% the normal price, so I got it and plan to drive around the Warrior River at night on calm nights this fall gathering wind data (and other data).
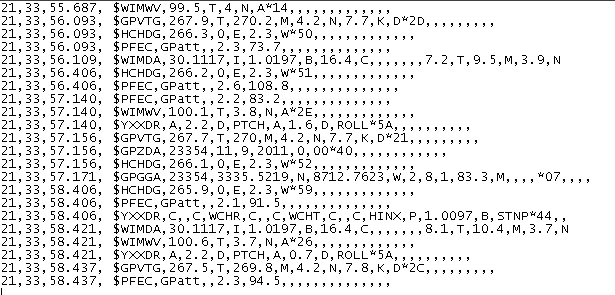
I ran a trial run last Saturday night, gathering a small amount of data. The data is logged like this:

But with some programming, you can decode it to produce a chart like this (with data every 2 seconds, so it can be 100,000 lines or more).

So, we’ll see how this works out this fall and spring on different parts of the river, and sitting still how it varies through the night. I’ll keep you posted. Mainly, it’s a fun gadget right now!


