Alabama Tornado Info
**No afternoon Weather Xtreme video this afternoon… please scroll down for the morning discussion, which is still very valid**
Thanks to Jim Westland of the Birmingham NWS for this very interesting read…
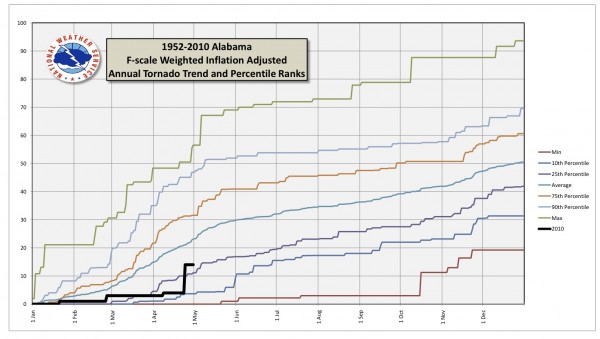
Back before the big tornado outbreak last weekend, it looked like we were in a tornado drought of sorts, with only 4 tornadoes statewide (1 in HUN’s area, 1 in TAE’s area, and 2 in our area) up until that point. I was inspired by both this chart and this blog posting to come up with a way to put the current year’s tornado count into perspective. The result is the attached chart, which shows the average and percentile ranks of cumulative daily tornado reports in Alabama throughout the course of a year. For those truly interested in how I came up with these numbers, please see the very end of this email. Otherwise, I’ll just offer up a few talking points based on the chart and its underlying data:
* We average (after adjusting for tornado report inflation) around 51 tornadoes per year.
* Even on an inflation adjusted basis, 2008 had the highest tornado count since 1952, with 93.6. The lowest year (inflation adjusted) was 1993 with 19.2.
* Before the 4/24 outbreak, the 4 statewide tornadoes were the lowest through that date since 2004 (which had just 2 tornadoes until 5/30)
* On the chart, you can see the slope of the “average” curve increase a little around March 1, and then level off a bit in the middle of May. This supports our usual definition of the spring severe weather season.
* There’s also a noticeable uptick in the second half of November, corresponding well with our perceived fall severe weather season.
Probably the most important talking point:
* A relative dearth of tornadoes early in the year does not necessarily have any predictive value of the number of tornadoes for the following periods. It only takes one outbreak of tornadoes to make a severe weather season significant or memorable, and we must continue to remind folks (as we did before Saturday’s outbreak) to not let our guard down.
Methodology (its a bit ugly — you have been forewarned):
It is a pretty well known and accepted fact that tornado reports have risen in recent years, not because there have necessarily been more tornadoes, but rather because of other factors (such as population, verification and surveying efforts, etc.). To account for this tornado report “inflation,” there needs to been some sort of adjustment made to the historical record so that we can put recent (and current) years’ data in proper perspective.
I used the SPC tornado database (starts in 1950) as my starting point, and from that I grabbed only the tornadoes that occurred in Alabama. From there, I used a methodology similar to that used by SPC on this page (https://www.spc.noaa.gov/wcm/adj.html). You first plot the raw number of tornadoes for each year, and from that obtain a linear trend line. Using that trend line as an “expected value”, you determine how much above or below the expected value each year was, which gives you the yearly delta value. The trend line is then flattened (early years are adjusted up, final year is held steady), and the delta values for each year are then applied to each trend adjusted value. This results in an inflation adjusted tornado total for each year.
The SPC methodology treats all tornadoes the same, regardless of F-scale rating. But, it has been shown that the increase in tornado reports since the 1950s is due to an increase in the number of F0s and F1s, while the numbers of F2s and above has remained virtually constant. Therefore, I used the above methodology to only adjust the numbers of F0 and F1 tornadoes for each year, but did not adjust the F2 and above tornadoes. Thus, the “F-scale weighted, inflation adjusted” tornado counts for each year.
So, each year’s inflation adjustment is a “fudge factor” of sorts, and we can apply each year’s fudge factor on the F0 and F1 tornadoes for each day of the year as well. You then cumulatively add up the adjusted number of tornadoes through the course of a year, and do that for all years (I started with 1952, since there were no F0s or F1s in 1950 or ’51, and including these years would have resulted in a division by zero error in the spreadsheet). Excel then has handy-dandy functions to calculate the average, and any percentile your mind can come up with. I chose 10-25-75-90 just to give a sense of what is considered much below, below, above, and much above the “normal.” As Kelly Bundy would say, “Viola!” The result is the attached chart, which also includes the (unadjusted) graph for 2010.
Category: Uncategorized


