One Forecast, Three Scenarios, Very Different Impacts
We constantly struggle to communicate a hurricane’s impacts and uncertainty.
One of our main tools is the “cone of uncertainty”. This graphic display shows the forecast track as dots at positions out through time along with a representation of the average forecast track errors.
Here is the official NHC definition:
The cone represents the probable track of the center of a tropical cyclone, and is formed by enclosing the area swept out by a set of circles (not shown) along the forecast track (at 12, 24, 36 hours, etc). The size of each circle is set so that two-thirds of historical official forecast errors over a 5-year sample fall within the circle.
What this means is that the center of the tropical cyclone should be within that cone of uncertainty 60-70% of the time.
But, the impacts of a tropical storm or hurricane obviously well away from the center.
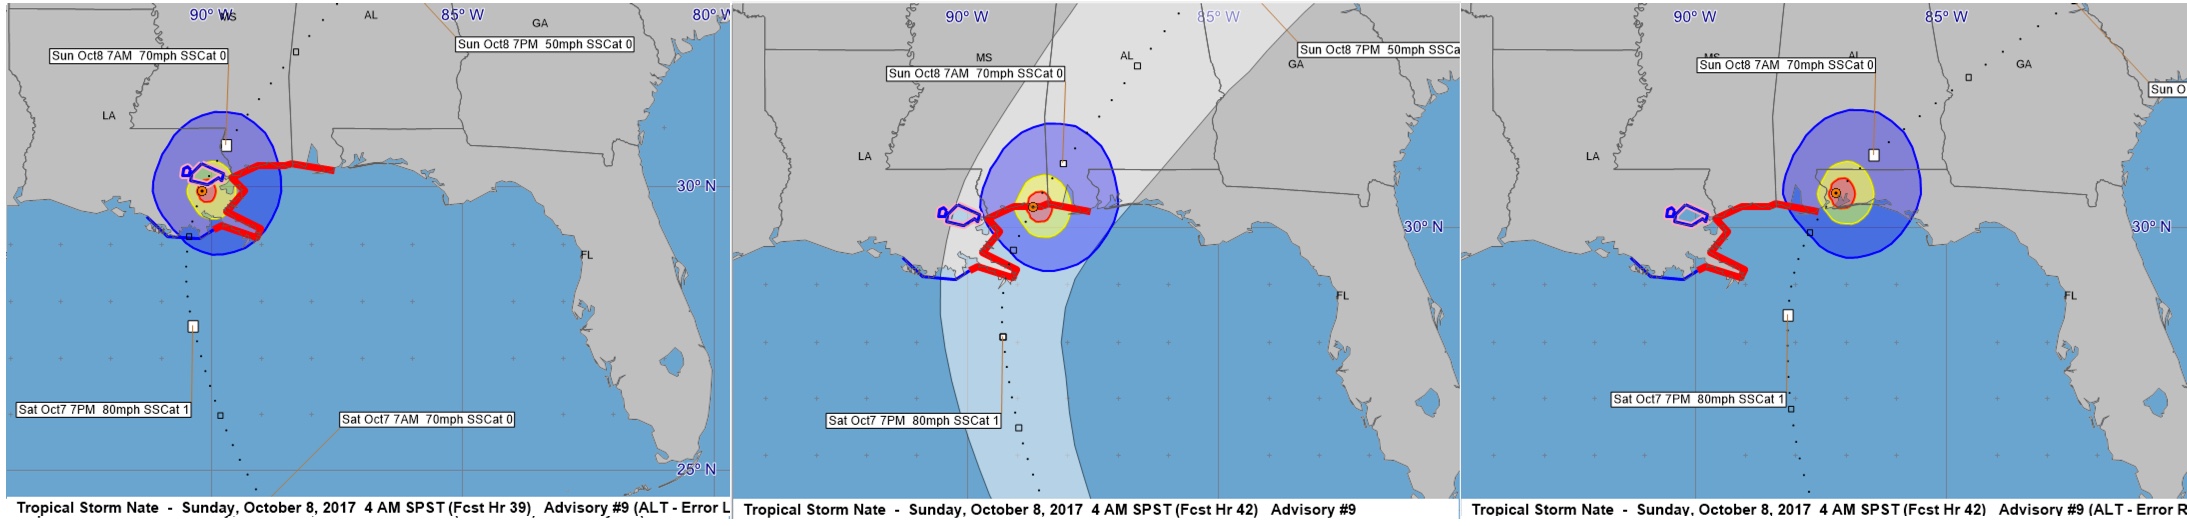
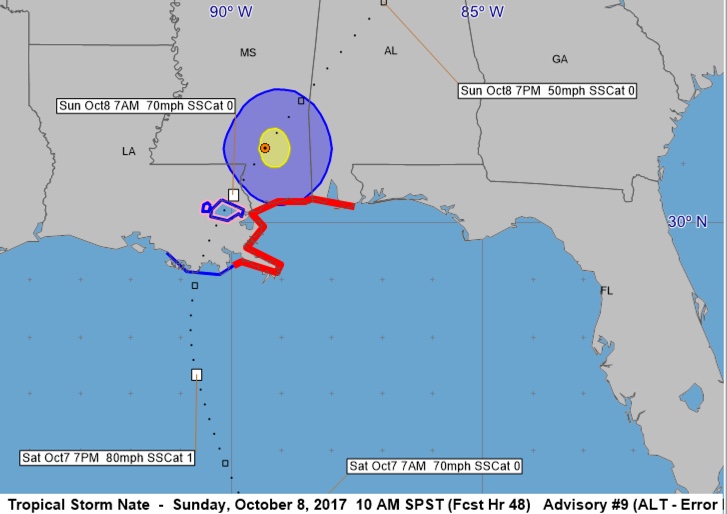
I have been thinking about a way to graphically show those impacts and I have found a way. The first case shows the expected wind impacts based on the official forecast or the most likely case:
Hurricane force winds would impact the Mississippi Coast over to near the Alabama/Mississippi border with tropical storm force winds from the Louisiana/Mississippi border to the Pensacola area, but the New Orleans area would not have winds of 39 mph or greater.
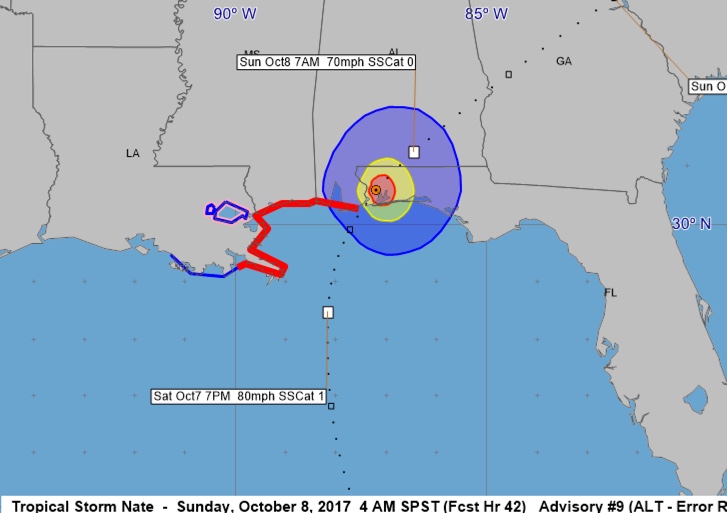
But there is around a 15% chance the center could be on the western side of the forecast error cone with much greater impacts also to the west:
This would bring hurricane force winds potentially to New Orleans, and keep the Alabama Coast and Northwest Florida Coast out of any tropical storm force winds. The Mississippi Coast would have tropical storm force winds but no hurricane force winds.
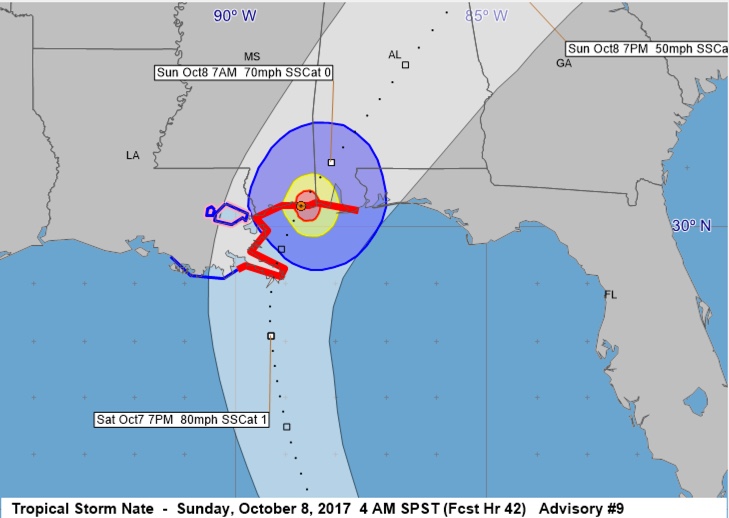
And conversely, if the center is on the eastern edge of the forecast error cone. Again about a 15% chance:
This would bring tropical storm force winds to the Alabama Coast and hurricane-force winds to Pensacola, but leave the Mississippi Coast and New Orleans area free of major wind impacts.
So as you can see, the official forecast should not be the only scenario we consider in a landfalling hurricane. Everyone should prepare for the worst potential case for their location. As I heard someone say the other day about models: every one of them is wrong, but some are useful. The same could be said for forecasts. They are almost always wrong, but they are usually useful!
Category: ALL POSTS, Met 101/Weather History
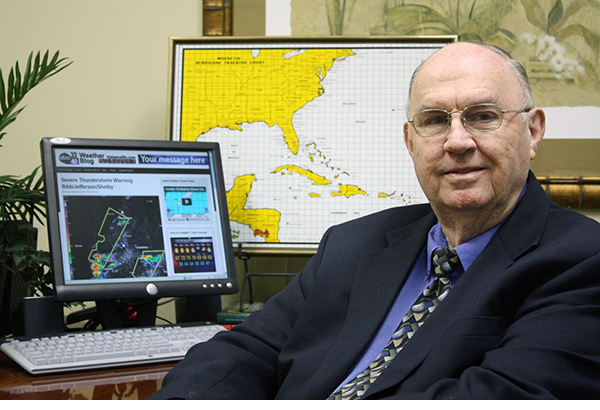
About the Author (Author Profile)
Bill Murray is the President of The Weather Factory. He is the site's official weather historian and a weekend forecaster. He also anchors the site's severe weather coverage. Bill Murray is the proud holder of National Weather Association Digital Seal #0001 @wxhistorianSubscribe
If you enjoyed this article, subscribe to receive more just like it.